For the demonstration of the risk-aware navigation system utilising integrated risks, a case study industrial plant layout was devised. Based on the review of past studies analysing the seismic risk of industrial plants (Caputo et al. 2020; Kalemi et al. 2019), several representative industrial plant processes that can be considered typical for the scope of the ROSSINI project were identified. In these aforementioned studies, the conducted plant processes were typically described, and a subsystem of components was analysed. However, a complete spatial description of the entire plant’s components and relative positioning was generally not available. The spatial description of the plant components and equipment with respect to one another was deemed a critical aspect necessary for the ROSSINI project. This is due to the navigation system requiring not only an individual measure of damage and potential risk of different parts of the plant but also their positioning, in addition to meteorological information to determine the likely patterns of potentially toxic material released into the local atmosphere.
To fill the missing gap, available plant layouts of several industrial facilities were made available to the ROSSINI project partners and analysed, where the relative distributions of the plant’s components and buildings were deduced based on engineering judgement to provide a navigable area for a hypothetical worker. The case study plant consists of several buildings of various processes, multiple liquid storage tanks, storage vessels, piping arrangements as well as an electrical substation. The emergency exits have been hypothesised as external environments toward which the worker is navigated to avoid any risk of potential harm within the industrial plant. The plant layout allows a hypothetical scenario that could satisfy the needs of the ROSSINI project in terms of spatial distribution, damageable component details, positioning to identify meteorological and seismic parameters and overall scale. The scale of the industrial plant refers to the overall footprint area of the plant and the number of pertinent areas to be studied. The objective was not to overly complicate the case study and instead focus on a simple and clear illustration that could effectively illustrate the functionality of the ROSSINI system developed, with a view of future extension to other more complex and particular plant layouts.
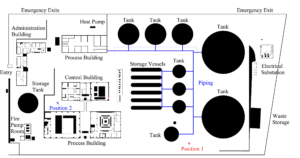
With the above considerations in mind, two industrial plant layouts were devised. The first map, termed Map A shown below, was created for actual simulation purposes and testing of the navigation instructions communicated to the app for various scenarios. Specifically, two real buildings located in Pavia (Italy) were used as pseudo layouts for the industrial plant to simulate the application for terrain easily traversable in reality. This was deemed a fair compromise to test the functionality of the system and circumvented the need to obtain clearance access to actual industrial facilities several times over the course of the project’s duration in order to test a navigation system. The image below depicts the non-traversable terrain (i.e., structural, and non-structural elements) in black, while the terrain surrounding the buildings as well as within a traversable area of the buildings was used for analysis until the user reaches the safe zones (blue) in case of hazard. Emergency exits were used within the buildings for safe exits and have a one-way direction, from orange to red as previously noted. While Map A is based on a real terrain readily accessible for testing to the project consortium, it contains virtual components pertinent to industrial plants and aims to provide complex yet fictitious scenarios that can be navigated and extensively tested.
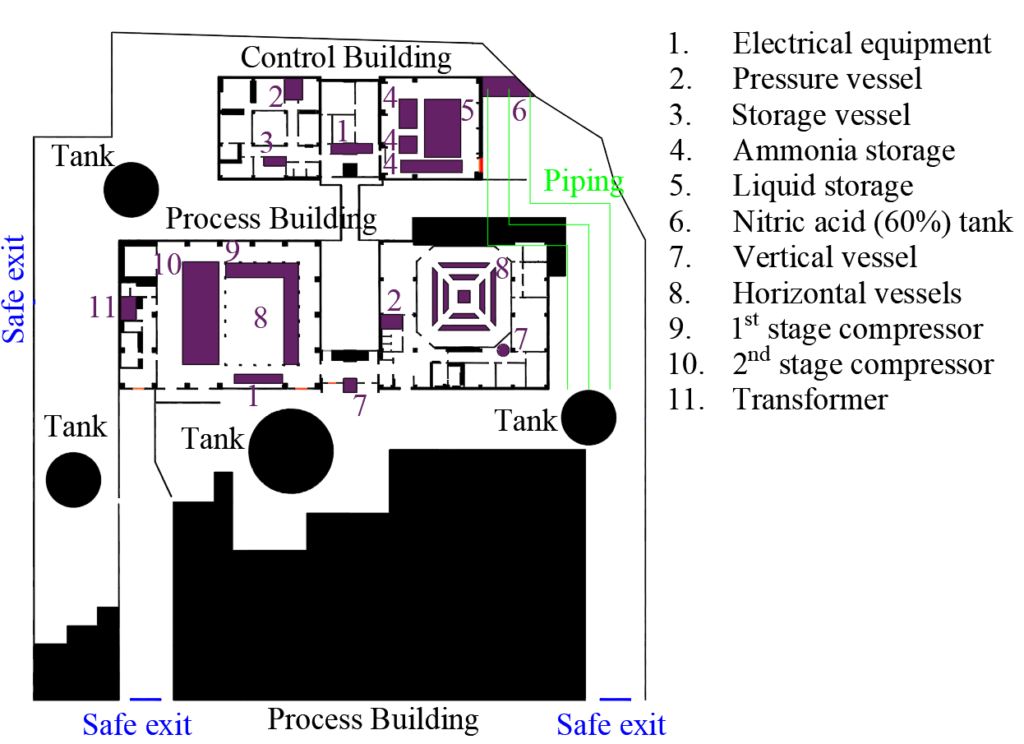
More in line with the layouts of actual industrial plants obtained during the project, Map A was enhanced to include various non-structural components such as tanks, piping racks, and storage vessels to simulate the effects of damaged components on the environment and workers’ health in a virtual environment within a larger setting to form what is termed Map B, depicted below. In reality, Map A is an accessible subset of the much larger Map B. The advantage of having Map B is mainly for illustration and testing purposes with a larger set of damageable inventory and navigable area, to further demonstrate the navigation software’s capabilities.