Calculation of environmental dispersion of released toxic substances
Atmospheric dispersion models are commonly employed for simulating the accidental continuous, transient, instantaneous or catastrophic release of chemicals from industrial plants, to predict air concentration levels of toxic substances in the surrounding environment. The Gaussian plume model ISCST3 is selected among different dispersion models, following recommendations by the Environmental Protection Agency. Concentration inside the plume is predicted by Gaussian statistics, with the centerline of the plume at the maximum of the Gaussian distribution and with the standard deviation of the Gaussian distribution an increasing function of time or downtime distance. During the release of concentrations, the ISCST3 model allows for describing the three-dimensional concentration field, produced by a point source under steady-state emission and meteorological conditions:
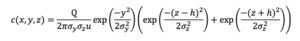
where c is the pollutant concentration at a given location, Q is the source term, x is the downwind, y is the crosswind and z is the vertical direction and u is the wind speed at the height of the release h. The σy=Iyx and σz=Izx deviations describe the crosswind and vertical mixing of the pollutant, where Iy and Iz are the turbulent wind speed fluctuations in the y and z directions, respectively. Dispersion values are determined by the magnitude of the turbulence in the atmosphere based on the Pasquill method.
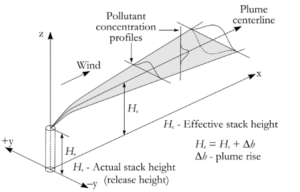
The figure below sketches the spreading of pollutants from a source point. The concentration of pollution downwind from a source is treated as spreading outward from the centerline of the plume following a Gaussian distribution. The plume spreads both horizontally (y-direction) and vertically (z-direction).
Quantitative calculation of toxic releases based on data from sensors
The Gaussian plume model ISCST3, used for modelling of the environmental dispersion of toxic substances, requires as input both emission (i.e., chemical name, release rate, height above the ground level of the release, geographical coordinates of the release point, temperature, physical state and exit velocity of the emitted substance) and meteorological (i.e., wind speed and direction, wind direction, air temperature, atmospheric stability Pasquill class and height of atmospheric mixing layer) data. Emission data are provided by both FBG and distributed backscattering-based sensors, whereas meteorological data are given by an automatic meteorological station.
For the quantitative calculation of toxic releases based on data from sensors, a simplified analytical model for the analysis of the discharge process of a pressurized vessel is also developed. The proposed model allows for estimating the instant mass outflow rate and also provides analytical relations allowing a continuous evaluation of pressure, temperature and density of the gas in the vessel. The simplified model assumes that the gas in the vessel is thermally and calorically perfect. The average velocity of the fluid in the tank is considered to be negligible with respect to the leakage velocity and contribution from gravitational potential energy is neglected. The leakage hole is modelled as a converging nozzle, with isentropic and quasi-unidimensional flow.
By modelling the opening of a leak as a converging nozzle, the mass outflow rate (ṁout) can be quantified via the following relations, depending on sonic or subsonic conditions:
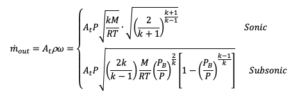
with At: leak area; ρ: gas density; ω: gas exit velocity; P and T: pressure and temperature of the gas in the vessel; PB: ambient pressure; k: gas specific heat ratio; M: molar mass and R: gas constant. The simplified analytical model also allows the discharge time assessment, which is essential for averaging the instant values of the outflow rate in the predetermined time window, in line with the input data required by the Gaussian models. Sensor data from optical fibres are then coupled with meteorological measurements and numerical simulations for estimating concentrations of chemicals in the industrial plant and simulating their spatial diffusion over time, as required by the environmental part of RIE Module.
Calculation and mapping of health risk values associated with potential exposure to released toxic substances
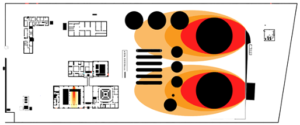
Health risk values, associated with the contamination levels in the environment are mapped for identifying hot spot areas with higher risk for the workers’ health. Structural and environmental risk maps are then superimposed to get a unified risk map shown below, which provides clear guidance to minimize the overall health risk for the workers. The combined risk map is input to the navigation system, calculating the safest exit path from the industrial plant.

Structural Risk Map
Environmental Risks
Combined Risk Maps